📊 Money Management
This article presents three basic investment concepts along with key portfolio management ratios.
Three Basic Investment Concepts
- risk-free rate
- standard deviation
- max drawdown
(i) Risk-Free Rate
The 'Risk-Free Rate' refers to the annual return an investor can earn without taking any market risk. It is typically calculated based on the annualized interest from holding a three-month treasury bill. Any investment offering returns below this guaranteed rate is considered unacceptable.
- In the EU, the 3-month Euribor is used.
- In the USA, the 3-month US Treasury bill is used.
(ii) Standard Deviation
Standard deviation (SD) is a statistical measure estimating the amount of variation in a set of values. A low standard deviation indicates values close to the mean (expected value), while a high standard deviation shows larger variations from the mean.
Why is a low standard deviation important for a portfolio? Because it ensures that the portfolio’s positive performance is consistent over time and more likely to be repeated in the future.
- Using standard deviation, investors can normalize a portfolio's historical returns to better evaluate them.
- Standard deviation can be applied to the returns of individual assets or entire portfolios.
- A smaller standard deviation is better, indicating consistent and predictable returns.
- Portfolios with low standard deviation are generally preferred over those with high deviation.
- Standard deviation is usually calculated on a monthly or yearly basis.
(iii) Max Drawdown
- Max Drawdown measures the maximum historical loss of a portfolio from its peak value. It favors portfolios that show limited losses over time.
- The lower the Max Drawdown, the better for an investment portfolio.
- When comparing similar portfolios, the one with the lowest Max Drawdown is considered superior.
- The longer the analysis period, the higher the Max Drawdown is likely to be.
Portfolio Management Ratios
Portfolio management aims to achieve the highest possible return while accepting the lowest possible risk:
(i) Maximizing return
(ii) Minimizing the likelihood and impact of loss
Since return and risk are the two key factors determining capital management success, combining them into a single metric simplifies portfolio management. This combined measure is called risk-adjusted portfolio return and is commonly used by professional portfolio managers.
Risk-Adjusted Portfolio Return
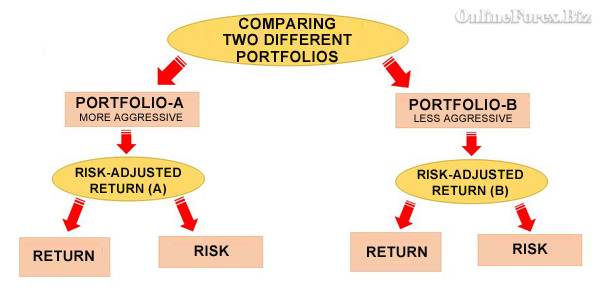
By unifying performance and risk into one measurement, it becomes easier to compare portfolios with different historical characteristics, as illustrated in the graph below.
Graph: The integration of return and risk facilitates comparison of portfolios with varying qualitative profiles

- Sharpe ratio
- Sortino index
- Treynor index
- Jensen Measure or Jensen's Alpha
- Calmar index
- MAR index
- Omega index
- Information Ratio
(1) Sharpe ratio
■ Sharpe Ratio = {(P - RFR) / SD(P)}
where:
□ P = Expected return
□ RFR = Risk-Free Rate
□ SD(P) = Standard deviation of a portfolio returns
(2) Sortino index
■ Sortino Ratio = (P - T) / SD(dP)
where:
□ P = Average annual return
□ T = Targeted-return
□ SD(dP) = Standard deviation of negative annual returns
(3) Treynor index
■ Treynor = (P - RFR) / b
where:
P = Portfolio performance
RFR = Risk-Free Rate
β = measures the volatility of a portfolio relative to the general market
(4) Jensen's Alpha or Jensen's Measure
■ Jensen's Alpha = P - {RFR + β * (P(m) - RFR)}
where:
□ P = The return on the portfolio
□ RFR = Risk-Free Rate
□ β = Beta coefficient
□ P(m) = The market return
(5) Calmar index
■ Calmar Ratio = (P - RFR) / MaxDrawdown
where:
□ P = Average annual portfolio return
□ RFR = Risk-Free Rate
□ MaxDrawdown (as above)
(6) MAR index
■ MAR Ratio = CAGR / MaxDrawdown
where:
□ CAGR = Compound Annual Growth Rate
□ MaxDrawdown (as above)
(7) Omega index
■ Omega Ratio = {Σ(Winning) - Benchmarking} / {Σ(Benchmarking) - Losing}
where:
□ Benchmarking = a reference performance
(8) Information Ratio
■ Information Ratio = {P - P(b)} / SD
where:
□ P = Portfolio performance
□ P(b) = Performance of a benchmark
□ SD = Standard deviation
Conclusions
-
The risk of losing part of your capital is as important—if not more so—than the potential for high returns.
-
A portfolio with the highest past returns is not necessarily the best investment; the risk taken to achieve those returns must be considered.
-
Combining risk and return into a single metric creates the risk-adjusted return, which allows comparison of portfolios with different characteristics.
-
Several indicators evaluate portfolio returns, with the Sharpe ratio being the most popular.
-
The Risk-Free Rate represents the annual return available in the market without risk; any investment expected to yield less than this is considered unacceptable.
-
The Max Drawdown measures the maximum loss a portfolio has experienced from its peak value—the lower, the better.
-
Standard deviation evaluates how consistent and predictable a portfolio’s returns are over time; portfolios with lower standard deviation are generally preferred over those with higher values.
■ Portfolio Management
G.P. for OnlineForex.biz (c)


